The Tournaments by Date summary helps you analyse your poker history in several ways.
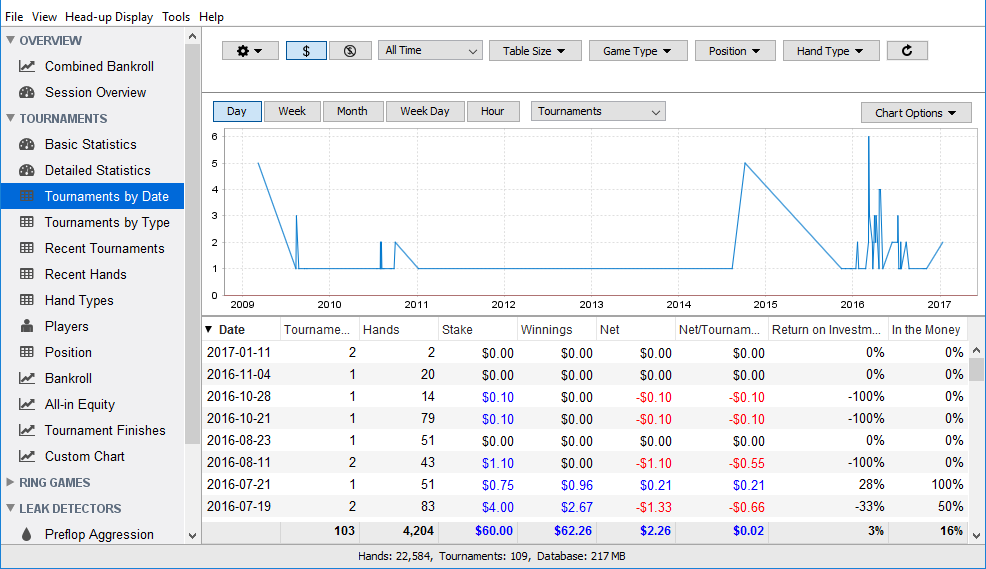
The time unit used to dissect your poker activity can be:
- Day, which is the default option,
- Week
- Month
- Year
- Week Day. This lets you see if playing on Fridays in the last six months has been more profitable than grinding on Sundays, for example.
- Hour. Are there certain hours of the day in which you win money? lose money? You can adjust your playing times accordingly.
Here is a list of the different data included in the summary that can be illustrated on the chart:
- Tournament
- Hands
- Buy-in
- Winnings: Winnings is the amount of money paid by the poker room when you win.
- Net: Winnings – Buy-in
- Net/Tournament
- Return on Investment
- In the Money
The Return on Investment (ROI) ratio is an important measure of your poker performance. Here is an example: You took part in a 10 players Sit & Go with a €5 buy-in, you finished at the second place and won €13.56. Your net is €8.56 (€13.56 – €5.00). Your ROI is 171% (you invested €5.00 to win €8.56).
In the Money measures the frequency at which you end up in paid places in tournaments. If you take part in 4 tournaments in a session and are getting paid in three, your ITM percentage for that session is 75% (3 / 4).
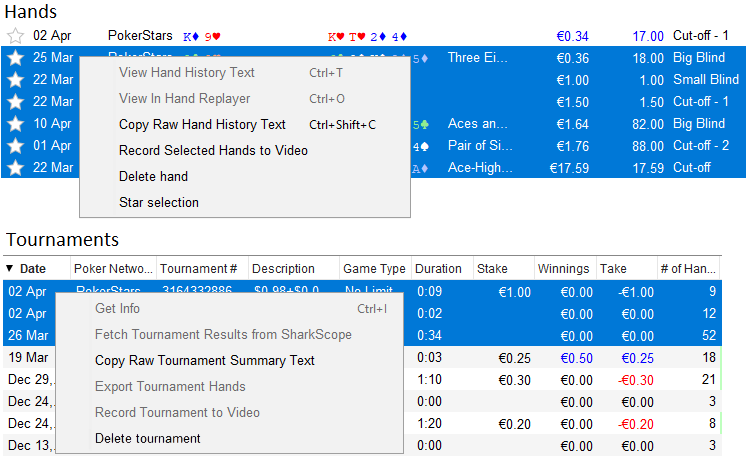
Multiple Selections You can multiple select hands or tournaments to perform some actions on desired selection. After making your selection, right click (secondary click on Mac) to see available options.